woensdag 6 november 2013

Part I : IpFire - Howto: Ubuntu Home Server (ZFS + virtual IpFire)

Series: Ubuntu Home Server (ZFS + virtual IpFire) 

-->Part I   : Ubuntu install and setting up IpFire (this post)<--

Ubuntu install and setting up IpFire 

Table of Contents:

Towards a next generation file system at home
Home server hardware specs
Ubuntu installation
Virtual firewall preparation
Virtual firewall set-up
Automatic starting of headless firewall VM


Towards a next generation file system at home


A few weeks ago I decided I wanted to move my home server to a next generation file system.  I realized I have rather a number of files I do not want to lose and I don't want to be 100 % dependent on Crashplan (who says this company is forever). Moreover it stands to reason that I never realize my files have gotten corrupt before I actually need them from backup. 

There are a number of options, but basically it comes down to the choice between either btrfs or ZFS. Given the still relatively unstable state of btrfs (currently raid 5/6 partitions cannot be scrubbed or integrity checked) the choice came down to ZFS. Luckily there is ZFS on Linux (ZoL) which provides a native Linux kernel port of the ZFS filesystem and is maintained by Lawrence Livermore National Laboratory (LLNL). 

To make a long story short, setting everything up was not difficult but there are some tricks that wou have made live easier if I'd known them, hence this post. My OS of choice was Ubuntu based on the large community, ZoL availability, webmin availability, virtualbox availability, and previous experience with Linux. 


Home server hardware specs:

So here's what I set up:


  • Ubuntu 12.04.03 LTS
  • ZFS on Linux (6 disk RAIDZ2 , double parity)
  • Virtual firewall (IpFire) running through Virtualbox
  • DHCP / DNS / samba file sharing
  • LAN runs in the 192.168.10.xxx range.

Running on:
  • Athlon II X3
  • 16 GB ECC RAM
  • 3 Ethernet adapters (2 for the firewall and 1 for the host OS)
  • 6 WD 2 TB disks (mix of Green and Red)
  • 500 GB bootdrive (2.5 " WD)


Ubuntu installation

Using a standard bootable USB stick I set up Ubuntu on a 30 GB partition (enabling me to have a small image which can be restored to another disk in the case of boot disk failure). 

The roles that I selected were :
  • LAMP (might want to host internal webpages)
  • DHCP
  • DNS
  • Samba
  • Postfix (configured as website but can also be smarthost (e.g. google))
After installation you will end up at a login prompt. Subsequently I installed the Xubuntu desktop for convenience using aptitude.
sudo apt-get install xubuntu desktop

After installation of the desktop I installed some tools via the terminal to enable hardware monitoring and make administration easy. Terminal can be found in 'Accessories' in the start menu.


Smartmontools:
sudo apt-get install smartmontools

lm-sensors:
sudo apt-get install lm-sensors

Afterwards configure with :
sensors-detect

Install gnome task manager:
sudo apt-get install gnome-system-monitor

chromium:
sudo apt-get install chromium-browser


Virtual firewall preparation


The next step is setting up the virtual firewall and configure it. In my case I had three dedicated network adapters I can use but obviously you can also work with vlans and a virtual network (though I prefer hardwired myself). Before you move forward there are some things to make sure you write down on paper to make identification easier later on. Decide which ethernet adapter should fullfill which role and note the (last 5 digits) of the mac address of each adapter. 


The data can be found using the gnome network manager (via the network icon in the menu bar or via settings in the start menu) or via ifconfig in terminal. Using the network manager I also rename the adapters for quick identification, for me:

Adapter   Name    Mac address

eth0      Red     x:xx:xx (Virtual firewall WAN / Internet) 
eth1      Green   x:xx:xx (Virtual firewall LAN / Network)
eth2      Host    x:xx:xx (Server LAN) 


This will allows you to connect the proper virtual adapters to the proper hardware adapters in virtualbox.

Should one of your network adapters be displayed as 'unmanaged' happens sometimes. You can resolve this in the following way.


Open a terminal and edit the network adapters config:
sudo leafpad /etc/network/interfaces 

In the file scroll to the section "# the primary network interface" and comment out lines "auto eth0" and "iface eth0 inet dhcp" (or eth1 depending on the one that was 'unmanaged' (by placing a # as a first character on the line), should look like:

# The primary network interface
# auto eth0
# iface eth0 inet dhcp

Then make the changes as mentioned above via the network configuration tool. 


Virtual firewall set-up:

Next steps are the actuall installation of the firewall, first install dkms to allow virtualbox to reconfigure the kernel modules for virtualbox:
sudo apt-get install dkms

also don't forget the kernel headers:

sudo apt-get install linux-headers-`uname -r` linux-headers-generic build-essential


Subsequently download and install virtualbox from https://www.virtualbox.org/wiki/Linux_Downloads
Open a terminal an navigate to download folder (when starting in home 'cd /Downloads' ) and install virtualbox (the xxx depends on the downloaded version):
sudo dpkg -i virtualbox-4.3.xxxxxxxxxx-amd64.deb

Note that you should download and install this way rather than using aptitude as aptitude will install an older version (4.1.xx) which does not play nice with the automatic startup / save stae script below.

After installation download IpFire from : http://www.ipfire.org/download


Open virtualbox under 'System' in the start menu and create a new virtual machine. Call it 'ipfire' (also make sure to use lowercase, this is important later on to have the machine autostart on boot).


The type of machine is a generic linux machine, reserve at least 512 MB of RAM (likely more than enough), 1 core, and create a 3 GB virtual hard drive (should also be plenty). After you have finished open the ípfire'virtual machine settings and go to 'network', now grab you note and pen. 


Hook up the first adapter to your 'red' ethernet adapter in 'bridged' mode. Create a second network adapter and hook it up to your green interface using again 'bridged' mode. Now add again the last digits if the mac addresses of the virtual adapters to your list (note that the host adapter has no virtual counterpart).


Adapter   Name    Mac      Virtual Mac

eth0      Red     x:xx:xx  x:xx:xx      (Virtual firewall WAN / Internet) 

eth1      Green   x:xx:xx  x:xx:xx      (Virtual firewall LAN / Network)

eth2      Host    x:xx:xx               (Server LAN) 


Next go to disks and select the virtual cdrom, klik next to the cd icon select mount image and browse to the downloaded IpFire image 'Choose a Virtual CD/DVD image' .


Before installing the firewall go back to the network adapters configuration tool. Open up your red adapter, go to Ipv4 amd set to 'disabled' , go to Ipv6 and set to 'ignore'. Also repeat this for the green adapter. This is to prevent bypassing the firewall and forcing the traffic through red, the firewall, and green from the WAN to the LAN network. 


Set your host adapter to the following settings in Ipv4:
ip address : 192.168.10.4
netmask : 255.255.255.224 (allows 30 hosts)
gateway : 192.168.10.1
dns : 192.168.10.4 (when you have installed a dns server, otherwise use your ISPs or Google (8.8.8.8))


Now start your virtualmachine and the ipfire setup should also autostart. Grab your note again (write down the root password and web interface password). Go through the setup and configure the 'Red' interface in ipfire to be connected to your first primary adapter:

Adapter   Name    Mac      Virtual Mac
eth0      Red     x:xx:xx  x:xx:xx      (Virtual firewall WAN / Internet) 

depending on your ISP you have to set it to DHCP (likely when using a router / modem) or use another configuration. But please refer to ISP documentation. 

Also set up the 'Green' adapter:

Adapter   Name    Mac      Virtual Mac
eth1      Green   x:xx:xx  x:xx:xx      (Virtual firewall LAN / Network)


Set this one to the static IP : 192.168.10.1 (will be the gateway for the network). After setup completes the virtual machine will reboot. If all has gone well connectivity to the machine. If not try to navigate to 192.168.10.1 , this should open up your ipfire webinterface and allows you to see if the firewall is correctly set up. If this is not the case chances are that you switched the red and green adapters. 


Automatic starting of headless firewall VM:


The last stage is to have your virtualmachine autostart / shutdown on boot and shutdown using a simple script (otherwise you have to do this manually every time, not very convenient):
sudo leafpad /etc/init.d/StartVM.

Copy Past the following in the file and replace "MyUser" with your ubuntu useracount name (mind capitals). If you used ipfire as virtualmachine name, you can keep that as is.:

#! /bin/sh
# /etc/init.d/StartVM
#
#Edit these variables!
VMUSER=MyUser
VMNAME="ipfire"
case "$1" in
 start)
   echo "Starting VirtualBox VM..."
   sudo -H -b -u $VMUSER /usr/bin/VBoxVRDP -s "$VMNAME"
   ;;
 stop)
   echo "Saving state of Virtualbox VM..."
   sudo -H -u  $VMUSER /usr/bin/VBoxManage controlvm "$VMNAME" 
savestate
   ;;
 *)
   echo "Usage: /etc/init.d/StartVM {start|stop}"
   exit 1
   ;;
esac
exit 0


Close leafpad and give the script executable permission with
sudo chmod +x /etc/init.d/StartVM

Tell the script be the first to shutdown and the last to startup.
sudo update-rc.d StartVM defaults 99 01

Now you should have configure a basic Ubuntu server with desktop and virtual firewall. Reboot to make sure everything works and your virtualmachine autostarts.

The next part will focus on the set up of ZFS, webmin and hardware monitoring.


woensdag 27 maart 2013

Bring back smoking in pubs and bars (why?-how?)

Let me start with saying I am not a smoker, yet I find myself frustrated about the recent turn of events. Over the last few years smoking in pubs has been banned. The rationale was that smoking, contrary to drinking, is a habit which directly adversely effects others around you (second hand smoke). As such legislation has been put into place to limit smoking to a defined area ('smoking room' or 'rokersruimte') so that those actively smoking would not harm others around them..

This is a perfect example of a politician's naive solution to a problem. 

Some problems:
1 -small bars do not have the space / fund to create a smoking room 
-> smokers are forced to smoke outside in front of the bar
-> complaints due to clouds os smoke in front of bars (e.g. in good weather if the sun shines)
-> larger bars have a state supported competitive advantage over smaller bars
2 -smokers like to smoke a cigarette and drink a beer next to it 
-> people move to the smoking room permanently
-> the smoking room becomes overcrowded and a fire hazard
3 -smoking bar owners are not allowed to smoke a cigarette in their own bar

Some let's list some pro arguments:
1 -banning smoking is good for public health
-> Actually it has been shown that alcohol is much worse than smoking for public health
(Nutt, King et al, The Lancet, Volume 376, Issue 9752, Pages 1558 - 1565, 6 November 2010, doi:10.1016/S0140-6736(10)61462-6)
-> Moreover, it has been shown shown that if all people stop smoking health care costs actually rise (as smokers tend to die young after a short sick bed; Barendregt, Bonneux, et al, N Engl J Med 1997; 337:1052-1057October 9, 1997DOI: 10.1056/NEJM199710093371506)

Note how the most harmfull drug is legal whereas a drug causing less harm (both absolute and relative) to others is banned...


So I guess we can say this is certainly untrue...

2 - Second hand smoke is harmful for kids
-> Again, this might be true, but we have scientific evidence that what these same kids are doing in this bar (i.e. drinking, might even be worse...)
-> There is a reason there is a minimal drinking age, if people are old enough to vote, drive a car and get married  they are old enough to decide what they do with their bodies (as they do in the former 3).... So this is a non-argument in my view..


3 - Second hand smoke is bad for pregnant women
-> True, but one can argue about the positive effects that drinking and staying up late have on pregnant women
-> Moreover these women are likely much more comfortable at home than in a sleazy bar
-> People can choose not to go to a smoker's bar...


And this is where the debate becomes interesting. There is nothing stopping people from setting up a non-smoking bar.This would give people a choice in the way they want to damage their health (which in the end is of interest to the state as it generates revenue).

My own (naive) solution to the problem:
Why not force bars to have smoking permit. When present people are allowed to smoke in a bar, when not present they are not. This is very similar to a liquor license and makes the option of having a non-smoking bar a little more interesting than it is..(cheaper liquor in non smoking bars)! Moreover, people can see from the outside weather or not it is a smoking bar if you force owners to put up a sign. It would also solve the problems of people smoking outside, the absence of room for a smoking area, would allow bar owners who choose this to smoke in their bars, etc. And it would provide governments with another source of income.

Most importantly it would give people a choice... Perhaps I (and by this I mean we, i.e. me and others as I live in the UK not NL atm) need to set up some sort of platform to push this legislation. After all the current problems are very similar to those that led to the introduction of liquor licenses in the first place in the 1800s...

Please contact me when you are interested! :)

vrijdag 8 februari 2013

Government budget of the Netherlands (1950-2013) - Part 1


Here I present an overview of the government budget of the Kingdom of the Netherlands between 1950 and the present. Samples have been taken approximately every 5 years and after 2002 every year. I show that purchasing power of the total budget peeked in the late 90’s and after 2000 dropped down to pre 90’s levels. Furthermore, we observe a shift in funds being diverted from the Defence, Public debt and Finance right after the second World War; to Education, Defence and Infrastructure in the 70’s; to Housing, Public debt and Education in the 90’s; and to Health care, Social security, and Education in more recent years. (Please excuse my lack of jargon and the correct terminology as economics is not my field).


Total budget growth
Since the Second World War the economy of the Kingdom of the Netherlands has grown tremendously. In particular the 1950’s and to a lesser extend the 1960’s were characterized by a high growth rate.[1] This growth declined in the 1970’s and 1980’s to be partially restored in the 1990’s. [1] Contrary to this economic growth, the total size of the budget has been growing slowly during the 1950’s and 1960’s but has been growing significantly faster during the 1970’s and the 1980’s, and lagging during the 1990’s (Figure 1). 


Figure 1: Growth of the government budget since the 1950 as obtained from the Statistics Agency of the Netherlands. The amount is converted to Euro’s from guilders but not inflation corrected. Note the quicker growth in the 70s and 80’s, which is repeated after 2007. The thin line is a moving average using 2 intervals.

Yet these figures were used as is and not corrected for inflation, so the next logical step would be to couple them to a form of purchasing power before we can draw any conclusion.


Purchasing power of the government budget
Unfortunately I was able to obtain inflation corrected figures, hence I was forced to improvise. In order to convert these figures to values representing some form of purchasing power, I used the following metrics: Price of crude oil (dollar, 1950 – present),[2] price of gold (dollar, 1950 – present),[3] price Maize (dollar, 1985 – present),[4] price of commodity metals (dollar, 1985 – present),[5] and naturally the dollar – guilder and dollar – euro exchange rates.[6-8] These were chosen to represent heating (oil), food (maize) and raw materials (gold and steel). Inclusion of more commodities would lead to more reliable results but was not doable for this post (yet people are welcome to use my figures and expand!).

The procedure described above allowed me to normalize the figures and create a more reliable image (Figure 2). For Figure 2A the budget size was expressed as ounces of gold this budget could buy as well as barrels of crude oil. Those two ranges were normalized between 0 and 1 over the time period 1950-2013 and the average of the two metrics was used to create figure 2A. Similarly for Figure 2B the budget was expressed in ounces of gold, barrels of oil, tons of maize and tons of metal (a composite index value), subsequently these values were normalized over the period 1985-2013. We now observe that while the absolute value of the budget grew quicker during the 1970’s and 1980’s, the commodity price caught up leading to a lower absolute purchasing power (likely caused by the steep rise in oil price and the decoupling of the dollar from gold). Moreover, we see that the total budget value (here expressed as purchasing power) actually declines rapidly after the peak of 2000. The absolute value in 2013 declines to pre 1990 values (interpolated as I have not received the 1990 government budget from the Statistics agency). 


Figure 2: Budget size expressed as an index value representing commodities the total budget value can buy. We now observe that, while the absolute value of the budget grew quicker during the 1970’s and 1980’s, the commodity price caught up leading to a lower absolute purchasing power. However, we also observe that in more recent years the commodity prices have grown so fast, the total purchasing power of the budget has actually declined to pre 1990’s  levels.


Development of the budget 1950 – 2013
Over the mentioned time period I wanted to see how the budget developed. What costs declined over time and what costs did rise. Can we rationalize the changes (coming from the zeitgeist)? To do this, I have calculated the percentage all individual expense categories makeup of the total budget. While this is not perfect, it should give an idea of prioritization and choices made in the past. However, a large number of different budgetary items have been introduced and removed over the years. Hence I more or less standardized this by using the categories as they are described in Table 1. It should be noted that ‘Inkomsten en Uitgaven Collectieve Sector’, which contained most social security costs upto 2009, was unavailable to me. These numbers were not provided by the statistics agency and I invite people who DO have these numbers to append to this work (the excel is available as a download).  

Table 1: Used standardized budgetary items.
Budgetary Item
General affairs and house of the Queen
Social Security
Public Health
Education/Culture
Public Debt Interest
Municipalities and Provinces
Foreign Affairs
Infrastructure
Defence
Finance
Justice
Home Affairs
Economic Affairs
Agriculture
Housing
Balkenende Item (Youth and integration) *
Mixed Balkenende Items *
Other *
Subtotal
Deficit *
Debt reduction *
Total
Items marked with an asterisk are only used when applicable.


Budgetary items reduced on average (1950 – 2013)
Let’s first examine the public debt interest costs (Figure 3). Very high right after World War 2 this figure declined quickly in the immediate post war era. However during the early 1980s recession, declined again and really peaked in the early 2000s.


Figure 3: Total public debt as a fraction of the total government budget. Declining after the Second World War, rose in the 80s recession and the early 2000s. While the total public debt rose over the last years, the actual interest resulting from the loans decreased.

While it is often considered a good thing to keep the burden of public debt interest as low as possible, there are other budgetary items that have been reduced over the years as shown in Figure 4.


Figure 4: Budgetary items that have been reduced over the period between 1950 and the present. While it is understandable that defense expenses have been reduced greatly after wartime levels, it can be stated that reducing them to about 2-3 % of the total might be another extreme. Similarly, it can be argued that infrastructure, something that the Netherlands are renowned for, should receive ample funding. With regards to agriculture, it could be argued that these expenses are transferred to EU budget. The ministry of housing has been absorbed by the ministry of Economic Affairs.

Budgetary items not showing a trend (1950 - 2013)
Next to items that show a decrease in spending there are some items that not show a clear trend. These items can increase or decrease with the zeitgeist and examples are shown in Figure 5. While most make up a small fraction of the total, the dominating line represents the money available for education and culture. Peaking in the 1970s (and likely responsible for the current educated professionals in society) is has been on the decrease over the last years. This could be considered a short sighted approach as the investments made in the 1970’s are still paying off today. 


Figure 5: Budgetary items showing no clear trend, increasing or decreasing with individual governments. However it can be seen that education / culture has always made up a significant fraction of the total budget whereas justice has made up a significantly smaller fraction.

Budgetary items rising on average (1950 – 2013)
This brings us to the final section, budgetary items making up a much large fraction of the budget over time. Not surprising this includes social security and public health. However it is noteworthy that the reforms of 2006 have not done much to decline the health spending growth. Both items are responsible for half of the total budget every year since 2010!
Furthermore, the provinces and municipalities are the 4th largest item on the budget, rising steadily over the years (Figure 6). According to Wikipedia the Netherlands went from 24th worldwide (when healthcare is expressed as % of the total) in 2008 to 2nd in 2010 ! (right after the US) See also the figures at Worldbank.[9]


Figure 6: Budgetary items growing as a fraction of the total over the period 1050 – 2013. While health costs and social security costs are expected to rise due to the ageing population, it could be considered that a 60 % cut of the total budget might be somewhat extreme.

Conclusion
Here I tried to organize and some figures about the Dutch government budget. While my overview is crude at best it serves to illustrate a shift in government spending. We observe clearly some high impact events like the fallout of the Second World War, the 1970’s energy crisis and initiation of the welfare state; the 80’s recession; the 90’s bubble and the recent crisis. Some general observations could be considered reason for change. The most important being the appearance that education, infrastructure and defense are being systematically sacrificed in favor of social security and health care. On the short term this might seem reasonable, but this could have some nasty long term consequences.


Needed follow up
What I have shown here is in need of a follow up. 
  • The numbers should be recalculated using the proper inflation corrected figures. 
  • Furthermore the 'Collectieve sector' should be included as far back as applicable. 
  • Moreover the missing samples (1990, 1980) should be included. 
Interesting other possible calculations could be:
  • Calculations of the size of the government budget as a fraction of GDP (inflation corrected).
  • Amount of people (e.g. police officers) that could be hired as a result of the changing budget.
  • Total size of the government budget expressed in times the average salary (or average people that can be hired.
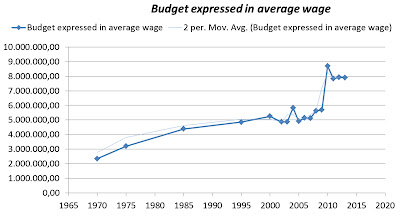
A preliminary plot is here, when we divide the total budget by the height of the average wage as obtained from GemiddeldInkomen.nl.[10] We get an approximation of the number of people that can be hired through the total budget. Interestingly this rises slowly (but steadily) from 2.000.000 in 1970 (earlier figures were not at my disposal) to 5.000.000 in 2008, to 8.000.000 (at 33.000 euro's average wage) in 2010!! That is a significant fraction of the population. This could indicate that (1) average wage is relatively low (has risen very slowly contrary to government buget), (2) government budget has grown out of proportion with people income (which could be indicating that taxes rise out of proportion, Figure 7).


Figure 7: Government budget divided by the average wage as an indicator of how many personnel the government could higer and hence the relative government size. Note the steep growth post 2010 / post crisis following a relatively stable period. 

Naturally this analysis should be redone using the proper number of people employed, it could also be (option 3) that those people employed just started to make significantly more money than average wage....

Please find the excel form I used here feel free to build or debunk my figures!

References